
|
What is AAII Investor Sentiment Survey?Since 1987, AAII members have been answering the same simple question each week. The results are compiled into the AAII Investor Sentiment Survey,
which offers insight into the mood of individual investors. Data represents what direction members feel the stock market will be in next 6 months.
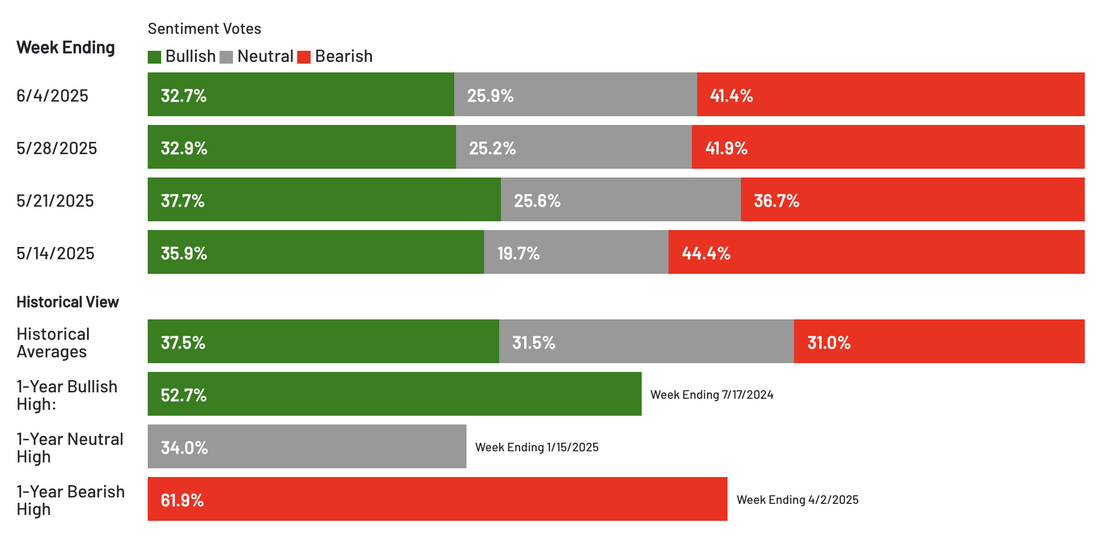
Last updated 6/4/2025
|
How is the AAII Investor Sentiment Survey calculated?
The AAII Sentiment Survey is conducted each week from Thursday 12:01 a.m. until Wednesday at 11:59 p.m. AAII members participate by visiting the AAII Sentiment Survey online and voting. The survey is open to all members, though a weekly email is sent to a rotating group of members reminding them to participate. Results of the survey are automatically tabulated by our database and published online early each Thursday morning. Prior to the year 2000, members responded by physically mailing a postcard back to the AAII offices. Response rates vary, though AAII would consider fewer than 100 votes to be low and more than 350 votes to be high. AAII does not track long-term response rates, though during the first four months of 2013, an average of 315 members took the survey each week.
The typical AAII member is a male in his mid-60s with a bachelor’s or graduate degree. AAII members tend to be affluent with a median portfolio size in excess of $1 million. The typical member describes himself as having a moderate level of investment knowledge and engaging primarily in fundamental analysis. This said, AAII has in excess of 160,000 members and simply due to the sheer size of our membership, there are wide variances in wealth, investment knowledge and investing styles. We also have many women members. This mix makes the AAII Sentiment Survey unique in that it conveys the attitudes of active, hands-on individual investors.
How is the AAII Investor Sentiment Survey used?
The AAII Investor Sentiment Survey has become a widely followed measure of the mood of individual investors. The weekly survey results are published in financial publications including Barron's and Bloomberg and are widely followed by market strategists, investment newsletter writers and other financial professionals.

Further Readings: U.S. Consumer Confidence Index (CCI)
In the US, the Consumer Confidence Index (CCI) is an economic indicator published by The Conference Board to measure consumer confidence, which is defined as the degree of optimism on the state of the U.S. economy that consumers are expressing through their activities of savings and spending.
This consumer confidence indicator provides an indication of future developments of households’ consumption and saving, based upon answers regarding their expected financial situation, their sentiment about the general economic situation, unemployment and capability of savings. An indicator above 100 signals a boost in the consumers’ confidence towards the future economic situation, as a consequence of which they are less prone to save, and more inclined to spend money on major purchases in the next 12 months. Values below 100 indicate a pessimistic attitude towards future developments in the economy, possibly resulting in a tendency to save more and consume less.
Further Readings: Michigan Consumer Sentiment Index (MCSI)
The Michigan Consumer Sentiment Index (MCSI) is a monthly survey of consumer confidence levels in the U.S. conducted by the University of Michigan. The survey is based on telephone interviews that gather information on consumer expectations for the economy.
The MCSI was created in the 1940s by Professor George Katona at the University of Michigan's Institute for Social Research. His efforts ultimately led to a national telephone survey conducted and published monthly by the university. The survey is now conducted by the Survey Research Center and consists of at least 500 telephone interviews posed to a different cross-section of consumers in the continental U.S. each month. The survey questions consumers on their views of their own personal finances, as well as the short-term and long-term state of the U.S. economy. Each survey contains approximately 50 core questions, and each respondent is contacted again for another survey six months after completing the first one.
The MCSI has grown from its inception to be regarded as one of the leading indicators of consumer sentiment in the U.S. History shows that consumer confidence has been at its lowest point just prior to and in the midst of recessionary periods.
Further Readings: Advance/Decline Line (A/D Line)
The advance/decline (A/D) line is a technical indicator that can reflect market sentiment by analyzing the collective behavior of stocks. The A/D line measures the market participation in a rise or fall and can indicate whether most stocks are participating in the market's direction.
Barron's began publishing A/D numbers in 1931, but it wasn't popularized until the 1960s. The advance/decline (A/D) line (or the advance-decline index) is calculated by subtracting the number of declining stocks from the number of advancing stocks on a given day and then adding the previous day's A/D line value. The A/D line is often plotted against a relevant index to help investors confirm trends and predict reversals.
The A/D line can help investors understand market performance and individual stock changes. For example, if the A/D line rises as the market does, it can indicate that the trend is strong and likely to continue. However, if the A/D line is falling while the market is still rising, it could mean that the trend is losing momentum and may reverse.
Further Readings: Social Market Analytics (SMA)
Social Market Analytics (SMA) tries to estimate sentiment for specific stocks, industries, sectors and indices from social media using Twitter’s data stream. SMA defines sentiment as the expression of an opinion of what is yet to come.
- For examples, the statement “Today is great!” expresses emotion, but contain no explicit prediction of the future, and the statement “Today will be great!” is a statement of sentiment, because the author predicts the day will be great.
- SMA’s algorithms filter Twitter’s data steam of Tweets and generate sentiment scores for individual securities, industries, sectors and indices. The filtered Tweets are “indicative” of social sentiment.

|
|

|
|