
|
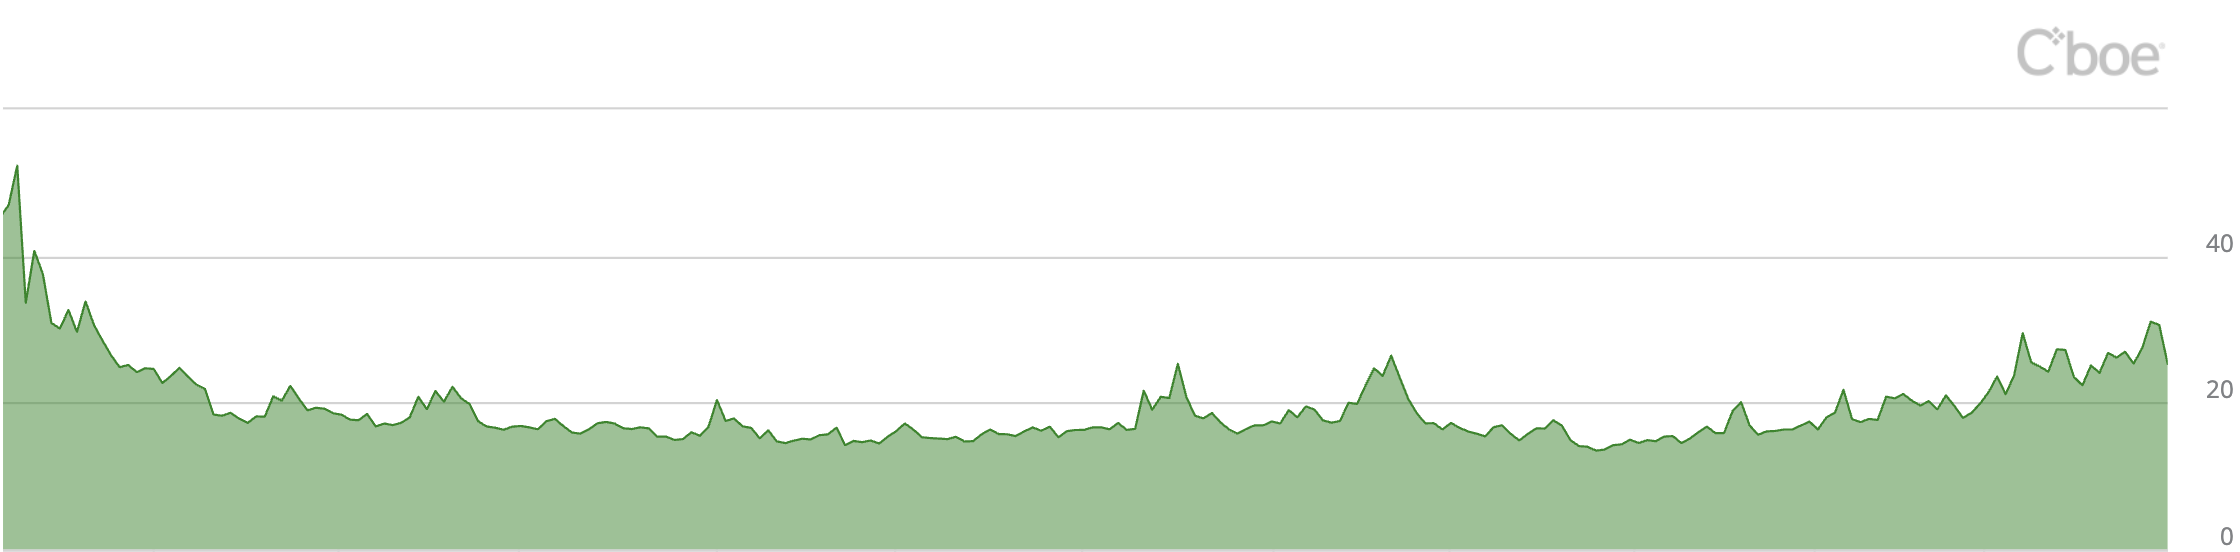
What is Cboe VIX Index?The VIX is designed to track the implied volatility of options on the S&P 500 Index: the higher the reading, the greater the market uncertainty.
Investors tend to buy options to cover their positions when they are uncertain about the future. This drives the options premiums up and, subsequently, the implied volatility. The rise in implied volatility creates more uncertainty hence triggering a stock sell-off and a slowdown in buying.
Volatility indices were first proposed in 1989 by two researchers, Menachem Brenner and Dan Galai. The duo recommended the volatility index to be named Sigma and to be updated frequently and used as a derivative for futures and options.
Cboe Global Markets revolutionized investing with the creation of the Cboe Volatility Index® (VIX® Index), the first benchmark index to measure the market’s expectation of future volatility. The VIX Index is based on options of the S&P 500® Index, considered the leading indicator of the broad U.S. stock market. The VIX Index is recognized as the world’s premier gauge of U.S. equity market volatility.
|
How is the VIX Index calculated?
The VIX Index estimates expected volatility by aggregating the weighted prices of S&P 500 Index (SPXSM) puts and calls over a wide range of strike prices. Specifically, the prices used to calculate VIX Index values are midpoints of real-time SPX option bid/ask price quotations.
The VIX Index is a calculation designed to produce a measure of constant, 30-day expected volatility of the U.S. stock market, derived from real-time, mid-quote prices of S&P 500® Index (SPXSM) call and put options. On a global basis, it is one of the most recognized measures of volatility -- widely reported by financial media and closely followed by a variety of market participants as a daily market indicator.
How is the VIX Index used?
The VIX Index is a widely followed gauge of investor sentiment created by the Chicago Board Options Exchange to estimate expected volatility using short-term S&P 500 index options. When the VIX rises, it’s quantifying increased levels of fear in the marketplace. In general, high-volatility periods correlate to stock market lows, so extreme high VIX readings can correspond to bottoms. Conversely, low-volatility periods can correspond to market tops.
How to invest in VIX? In periods of high global economic uncertainty like today, the markets tend to be extremely volatile. Volatility is negatively correlated to stock market returns which means that it increases when returns decline and vice versa. For a balanced portfolio, traders must include an asset that is positively correlated with volatility.
The VIX Index is used as a barometer for market uncertainty, providing market participants and observers with a measure of constant, 30-day expected volatility of the broad U.S. stock market. The VIX Index is not directly tradable, but the VIX methodology provides a script for replicating volatility exposure with a portfolio of SPX options, a key innovation that led to the creation of tradable VIX futures and options.
Further Readings: ICE MOVE Index - Bond Market Volatility
The MOVE Index has a long history of providing strong signals about bond market sentiment. It is a well-recognized measure of U.S. interest rate volatility that tracks the movement in U.S. Treasury yield volatility implied by current prices of one-month over-the-counter options on 2-year, 5-year, 10-year and 30-year Treasuries.
One can think of the MOVE as the VIX for Bonds. By its design, MOVE has the unique ability to provide a signal for changing risk sentiment in the fixed income markets.
One can think of the MOVE as the VIX for Bonds. By its design, MOVE has the unique ability to provide a signal for changing risk sentiment in the fixed income markets.
Further Readings: The volatility of volatility - VVIX
VVIX is calculated from VIX options. The formula is a complex weighting of out-of-the-money options to create a metric for the market's estimation of what the volatility of the VIX index might be in 30 days. The value of the VVIX can indicate when the VIX isn't very volatile and isn't foreseeing much volatility in the SPX. This can happen when the VIX is relatively low (e.g., 15). Alternatively, a high VVIX suggests the VIX might be more volatile in the future, which in turn can indicate a market belief that the SPX might also be more volatile.
Further Readings: Fixing the VIX - An Indicator to Beat Fear
There is a simple volatility indicator available in the public domain that can be used to implement trading strategies based on the concept of VIX. This indicator, the VIX Fix developed by Larry Williams, overcomes the limitations of VIX. Amber Hestia-Barnhart reviews what VIX is, highlight some of its limitations of VIX, describes an alternative to VIX and provides test results demonstrating how well the VIX Fix works.
Further Readings: Smart-Dumb Money Confidence Index
It is interesting to see SentimenTrader.com has compiled a handful of models beyond the VIX Index to capture the market sentiment with time frames between intraday and weekly. They track many indicators on a daily and weekly basis that can be separated into "dumb money" and "smart money". The dumb money indicators are typically made up of retail traders and trend-followers. The smart money indicators are mostly made up of institutional accounts.
Smart Money Confidence Indicator is a model that aggregates indicators reflecting sentiment among investors that tend to use the stock market to hedge underlying positions. Or, they're just contrarian investors who prefer to sell into a rising market and buy into a declining one.
Dumb Money Confidence Indicator is a model that incorporates more than a dozen indicators that have a track record of cycling to extremes, and equating with ebbs and flows in sentiment among broad categories of investors.
Dumb Money Confidence Indicator is a model that incorporates more than a dozen indicators that have a track record of cycling to extremes, and equating with ebbs and flows in sentiment among broad categories of investors.
Many trading platforms today use sentiment market indicators to gauge the market’s mood. Traders expect a reversal when these indicators are going too far in either direction. In addition to VIX, other most important sentiment market indicators include:
Further Readings: Smart-Dumb Money Confidence Index
VIX is a simple volatility indicator available in the public domain that can be used to implement trading strategies. The VIX Fix, developed by Larry Williams, is a variation of VIX indicator that tries to overcome the limitations of VIX. Amber Hestia-Barnhart reviews what VIX is, highlight some of its limitations of VIX, describes an alternative to VIX and provides test results demonstrating how well the VIX Fix works.

|
|

|
|